This post if part of a series about the File System Toolkit - a custom content delivery API for SDL Tridion.
This post presents performance data that was captured for each major functionality with and without caching Linking, CP Assembler, Component Presentation Factory, Dynamic Content Queries, Model Factory.
The data was captured on a 2014 Macbook Pro 15", 16 GB RAM, 2.6 GHz Intel Core i7 running OS X El Capitan.
Test methodology: each test was run for 3 minutes and the total number of successful Toolkit API calls was measured. Then the number of calls per second was computed 'with cache' and 'without cache' test runs. Then a cache boost factor was calculated by diving (the number of API calls with cache) / (number of API calls without cache).
Each cache test was executed 3 times, with different cache time-to-live values of 1 second, 5 seconds and 0 seconds (eternal cache, no expiration). The rationale is to see what impact different cache expiration/eviction values have on the overall performance.
Then finally the entire suite of tests was run twice in order to calculate averages.
Models read per second: 1.9m (with cache) and 26k (without cache)
Cache boost: 73x
Links resolved per second: 383k (with cache) and 26k (without cache)
Cache boost: 15x
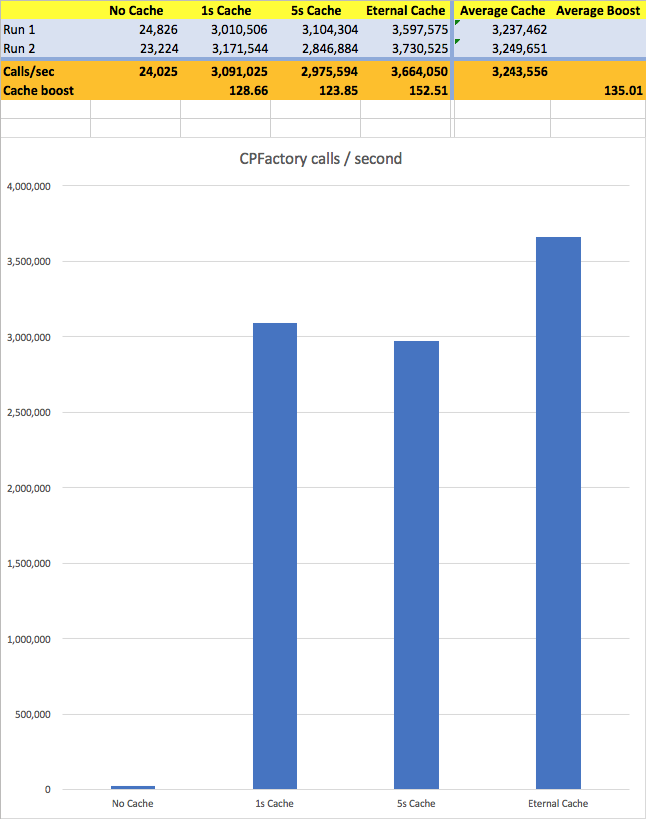
CPFactory calls per second: 3.2m (with cache) and 24k (without cache)
Cache boost: 135x
CPAssembler calls per second: 55k (with cache) and 17k (without cache)
Cache boost: 3x
Dynamic queries per second: 6.8k
This post presents performance data that was captured for each major functionality with and without caching Linking, CP Assembler, Component Presentation Factory, Dynamic Content Queries, Model Factory.
The data was captured on a 2014 Macbook Pro 15", 16 GB RAM, 2.6 GHz Intel Core i7 running OS X El Capitan.
Test methodology: each test was run for 3 minutes and the total number of successful Toolkit API calls was measured. Then the number of calls per second was computed 'with cache' and 'without cache' test runs. Then a cache boost factor was calculated by diving (the number of API calls with cache) / (number of API calls without cache).
Each cache test was executed 3 times, with different cache time-to-live values of 1 second, 5 seconds and 0 seconds (eternal cache, no expiration). The rationale is to see what impact different cache expiration/eviction values have on the overall performance.
Then finally the entire suite of tests was run twice in order to calculate averages.
Model Factory
Only read model operations were calculated. The reasoning is that Deployer extension is the only one that creates / writes the JSON files and as such that operation is much less frequent than read operations that are used all the time during the normal functioning of the Toolkit.Models read per second: 1.9m (with cache) and 26k (without cache)
Cache boost: 73x
 |
| Model Factory read performance |
Link Factory
The test executed component, page and binary links. Each LinkFactory method was executed and counts as one API call.Links resolved per second: 383k (with cache) and 26k (without cache)
Cache boost: 15x
 |
| Link Factory resolve performance |
Component Presentation Factory
The test executed getComponentPresentation and getComponentPresentationWithHighestPriority factory calls. Each call counts as one API call. Each factory calls makes one ModelFactory read call, so the times below include also the ModelFactory call duration.CPFactory calls per second: 3.2m (with cache) and 24k (without cache)
Cache boost: 135x
 |
| Component Presentation Factory read performance |
Component Presentation Assembler
The test executes a getComponentPresentation factory method which counts as one API call. The call includes a CPFactory call, so the times below include also the CPFactory call duration.CPAssembler calls per second: 55k (with cache) and 17k (without cache)
Cache boost: 3x
 |
| Component Presentation Assembler performance |
Dynamic Content Query
The dynamic content queries are not cached. Therefore, the times below are pretty much the same. The tests were executed using different combinations of query criteria (custom meta, schema, date ranges, pagination, and vs or complex queries). Each query counted as one API call. The numbers below represent an average duration of each of these queries. No models were created during the dynamic queries, the queries simply returned the TcmUri of the identified items.Dynamic queries per second: 6.8k
 |
| Dynamic Query performance |

Comments